In this post I’m going to run through manipulate an image multiple ways using Numpy in python.
First let’s start by importing the libraries we need to manipulate, import/export and visualize the image:
import numpy as np
from skimage import io           # read in an image
import matplotlib.pyplot as plt  # visualization
to import the image and print it’s array:
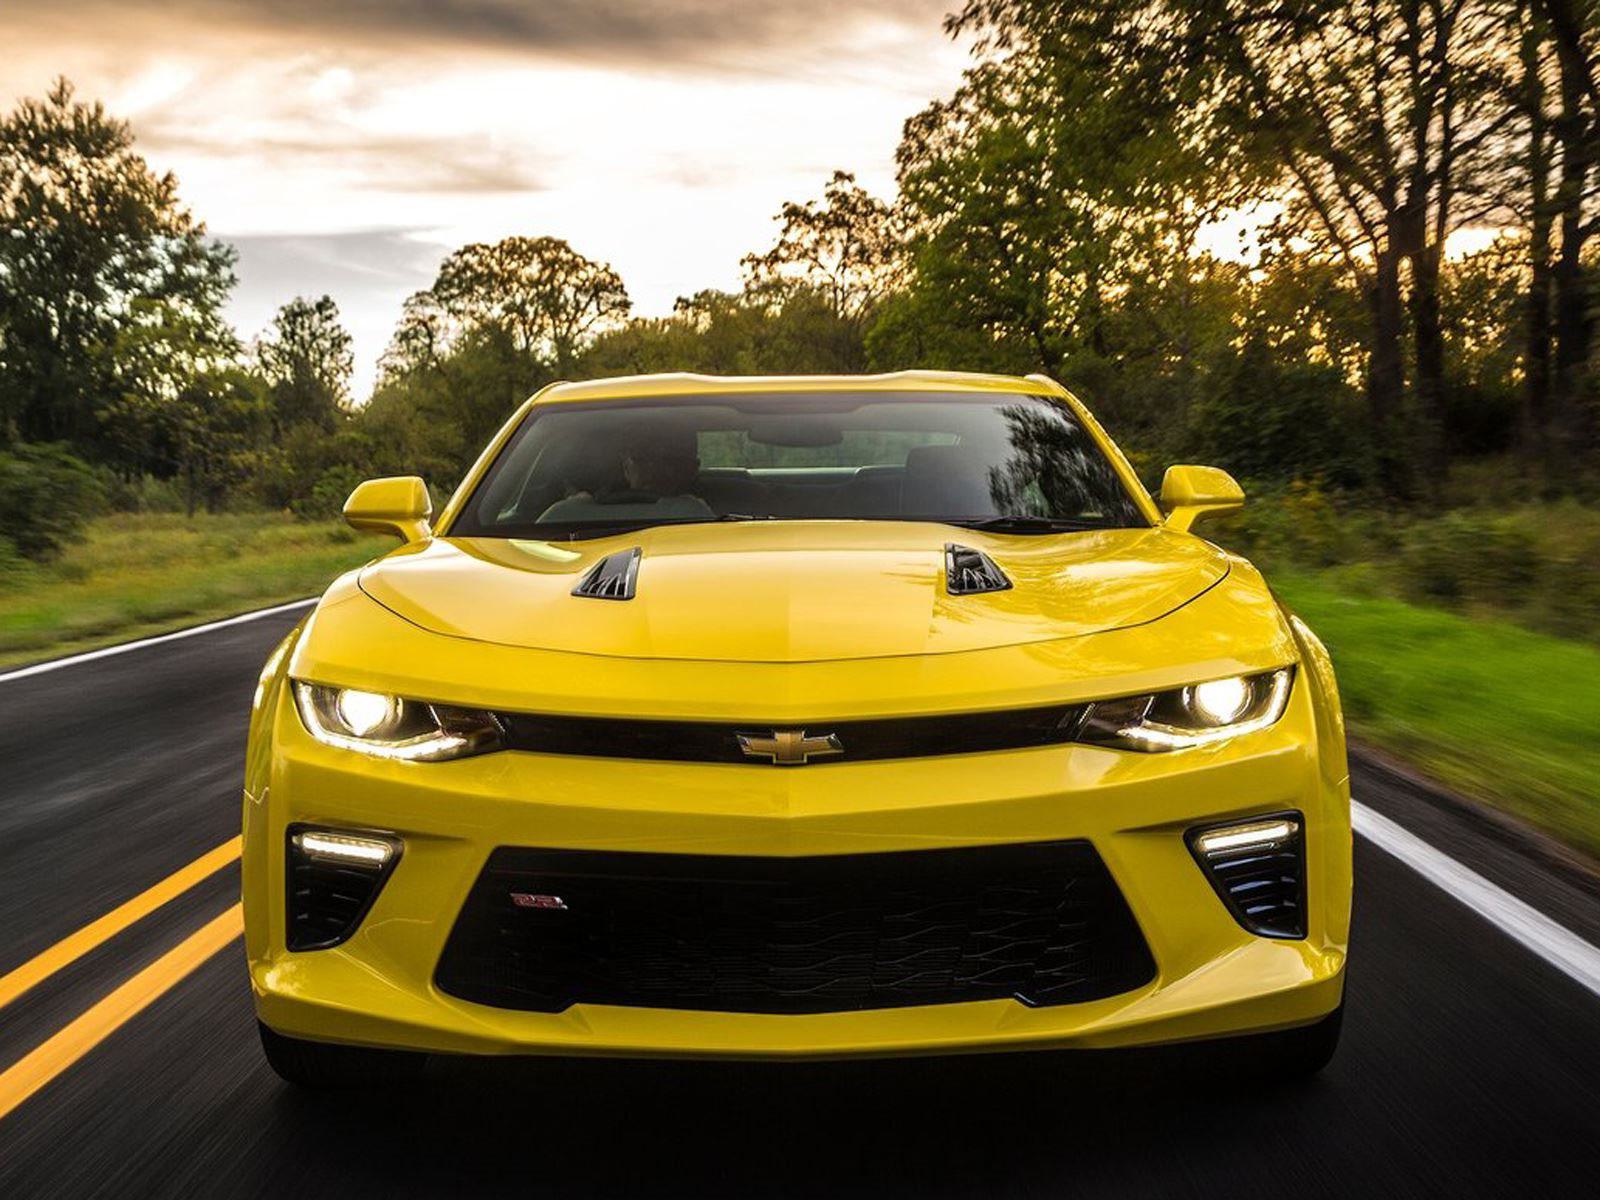
camaro = io.imread("camaro.jpg") # import image
print(camaro)                    # print image array

>>> [[[ 83  81  43]
      [ 57  54  19]
      [ 34  31   0]
      ...
      [179 144 112]
      [179 144 114]
      [179 144 114]]

     [[ 95  93  55]
      [ 72  69  34]
      [ 46  43   8]
      ...
      [181 146 114]
      [181 146 116]
      [182 147 117]]

     [[101  99  61]
      [ 88  85  50]
      [ 67  63  28]
      ...
      [184 149 117]
      [184 149 117]
      [184 149 119]]
Each one of the 3 above arrays is for a certain colour (red, green and blue, and each one has 1200 rows and 1600 columns.
camaro.shape

>>> (1200, 1600, 3)
results are (1200, 1600, 3) which means ( 1200 rows of pixles, 1600 columns of pixles, 3 dimensions of colors), the red, green and blue color intensities varry between 0 and 255. imagine a cuboid with length of 1200, width of 1600 and depth of 3.
Let’s start by plotting the image, then manipulate it:
plt.imshow(camaro)
plt.show()
# plot image
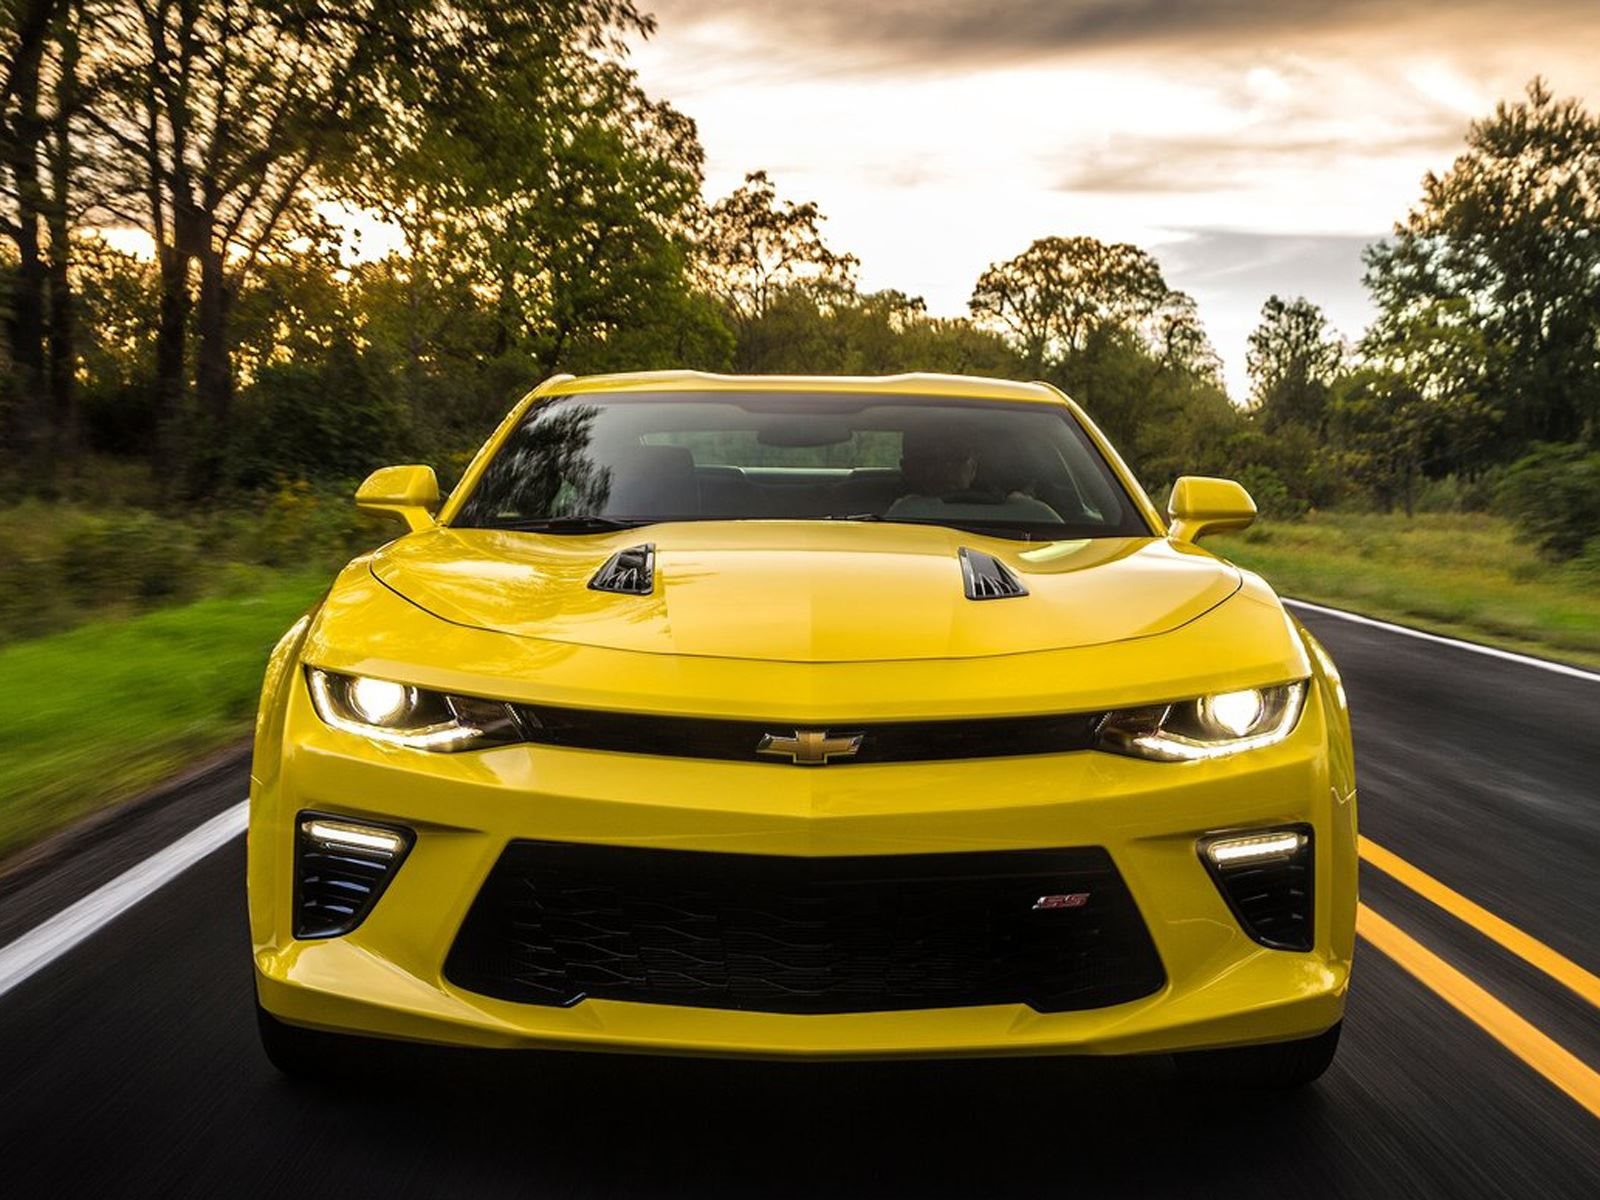
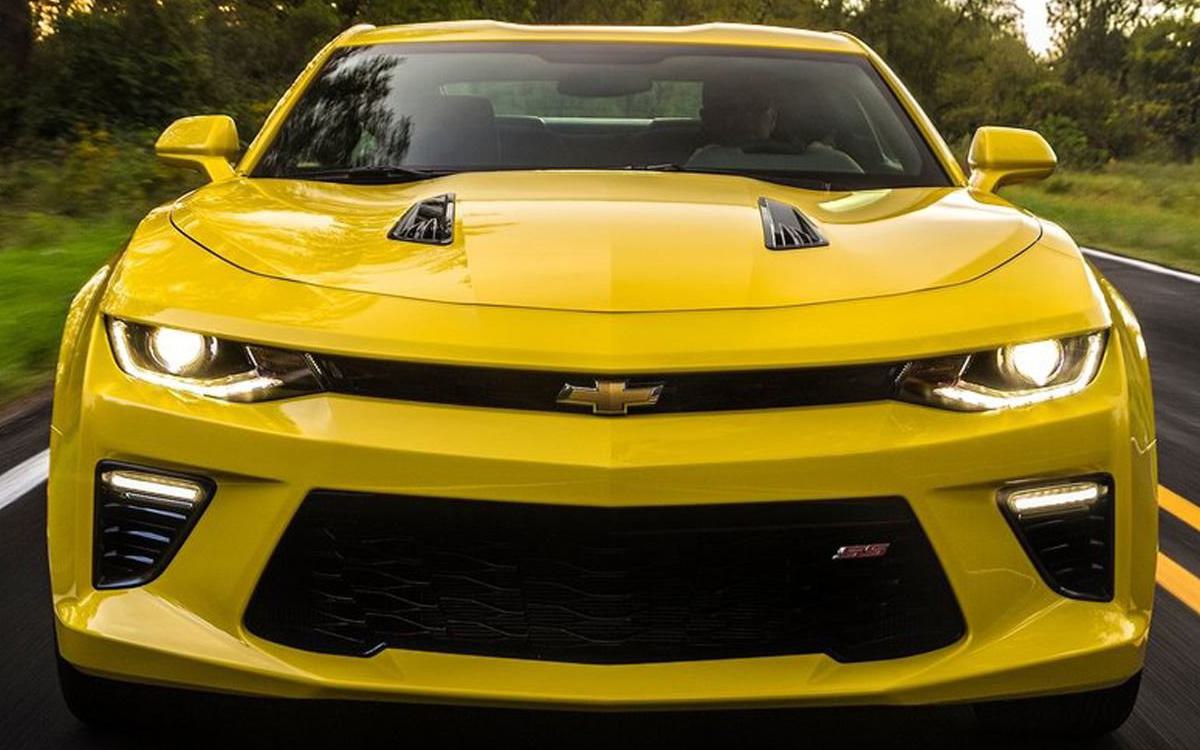
The first manipulation will be to crop to show focus on the car only, but for demonstration purposes, we can crop by length and width or color as well:
cropped = camaro[0:500,:,:] # will crop the rows from 0 to 500 (cropping length)
plt.imshow(cropped)
plt.show()
# this will result in an image that shows only the first 500 rows of pixles

cropped = camaro[:,400:1000,:]
plt.imshow(cropped)
plt.show()
# this will result in an image that shows only 600 columns of pixles between column 400 and 1000

cropped = camaro[350:1100,200:1400,:]
plt.imshow(cropped)
plt.show()
# and this results in the image you can see below, which is cropped to focus on the car

io.imsave("camaro_cropped.jpg", cropped) # to save the image
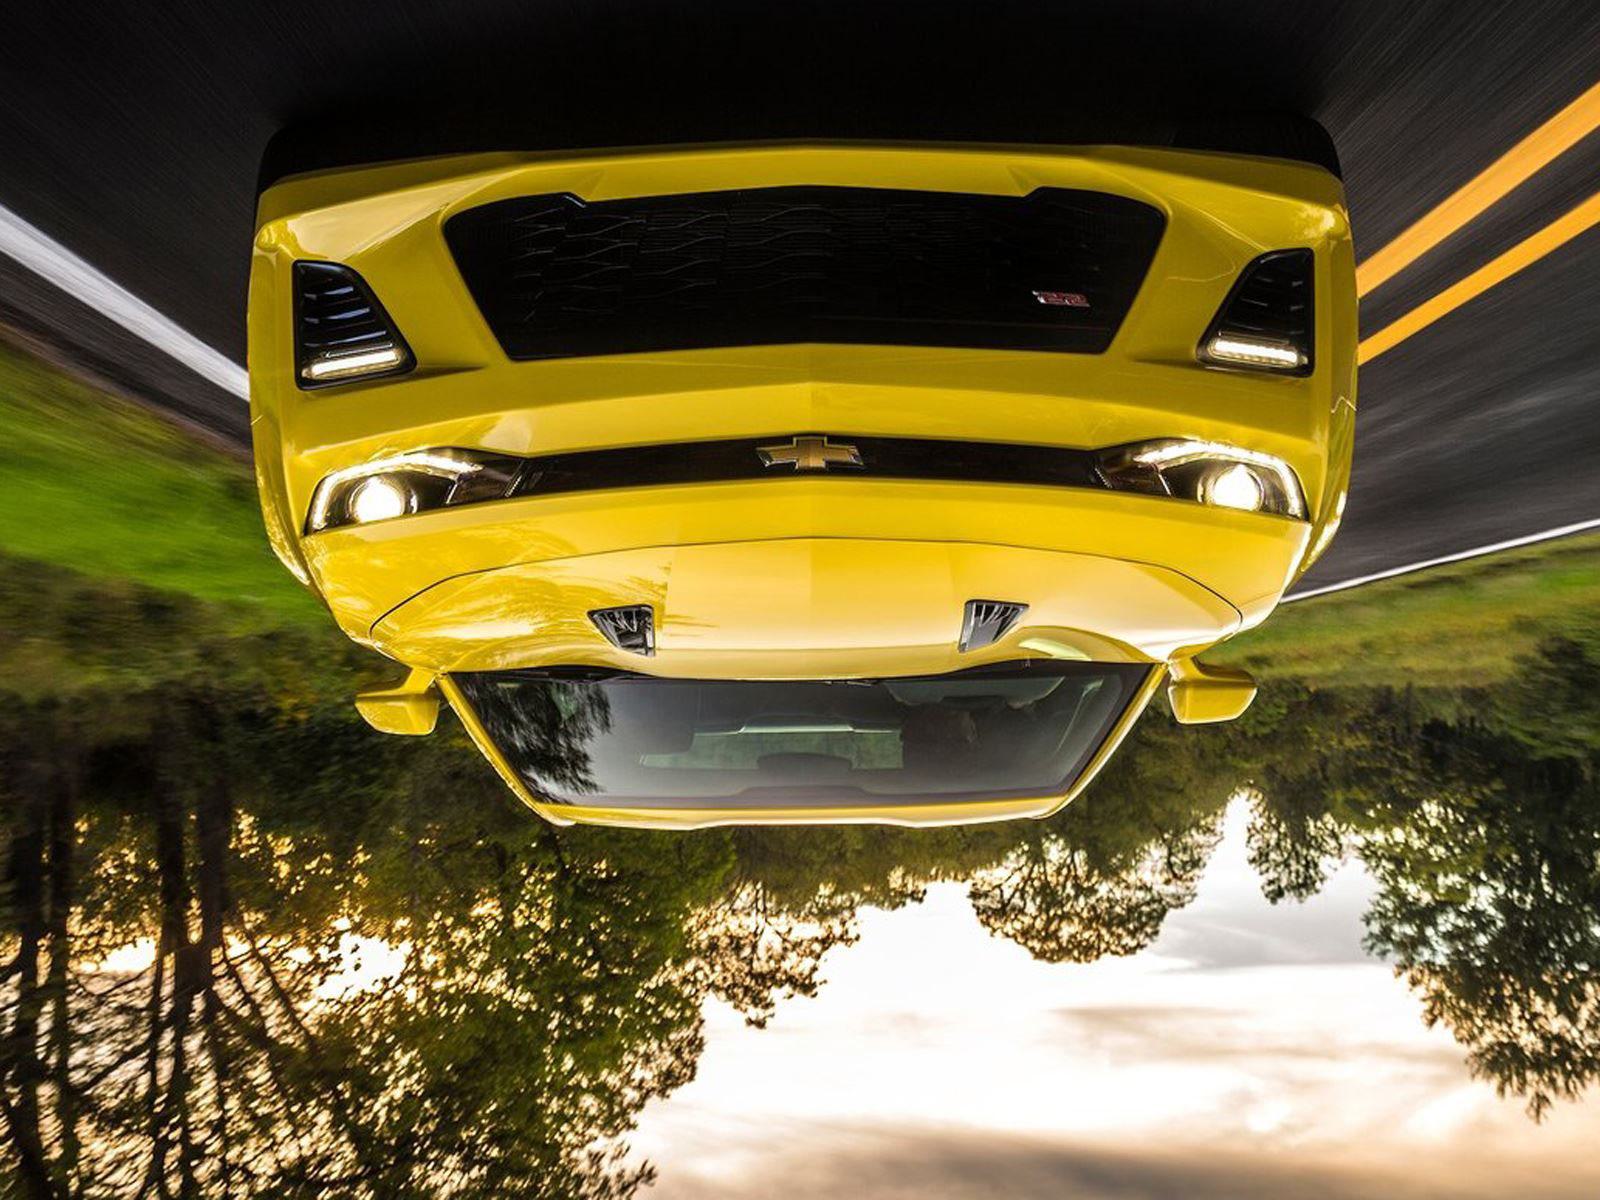
we can also flip the image vertically:
vertical_flip = camaro[::-1,:,:] # to flip vertically
plt.imshow(vertical_flip)
plt.show()
io.imsave("camaro_vertical_flip.jpg", vertical_flip)
or horizontally (although it doesn’t seem much different from the original, but it’s flipped):
horizontal_flip = camaro[:,::-1,:] # to flip horizontally
plt.imshow(horizontal_flip)
plt.show()
io.imsave("camaro_horizontal_flip.jpg", horizontal_flip)
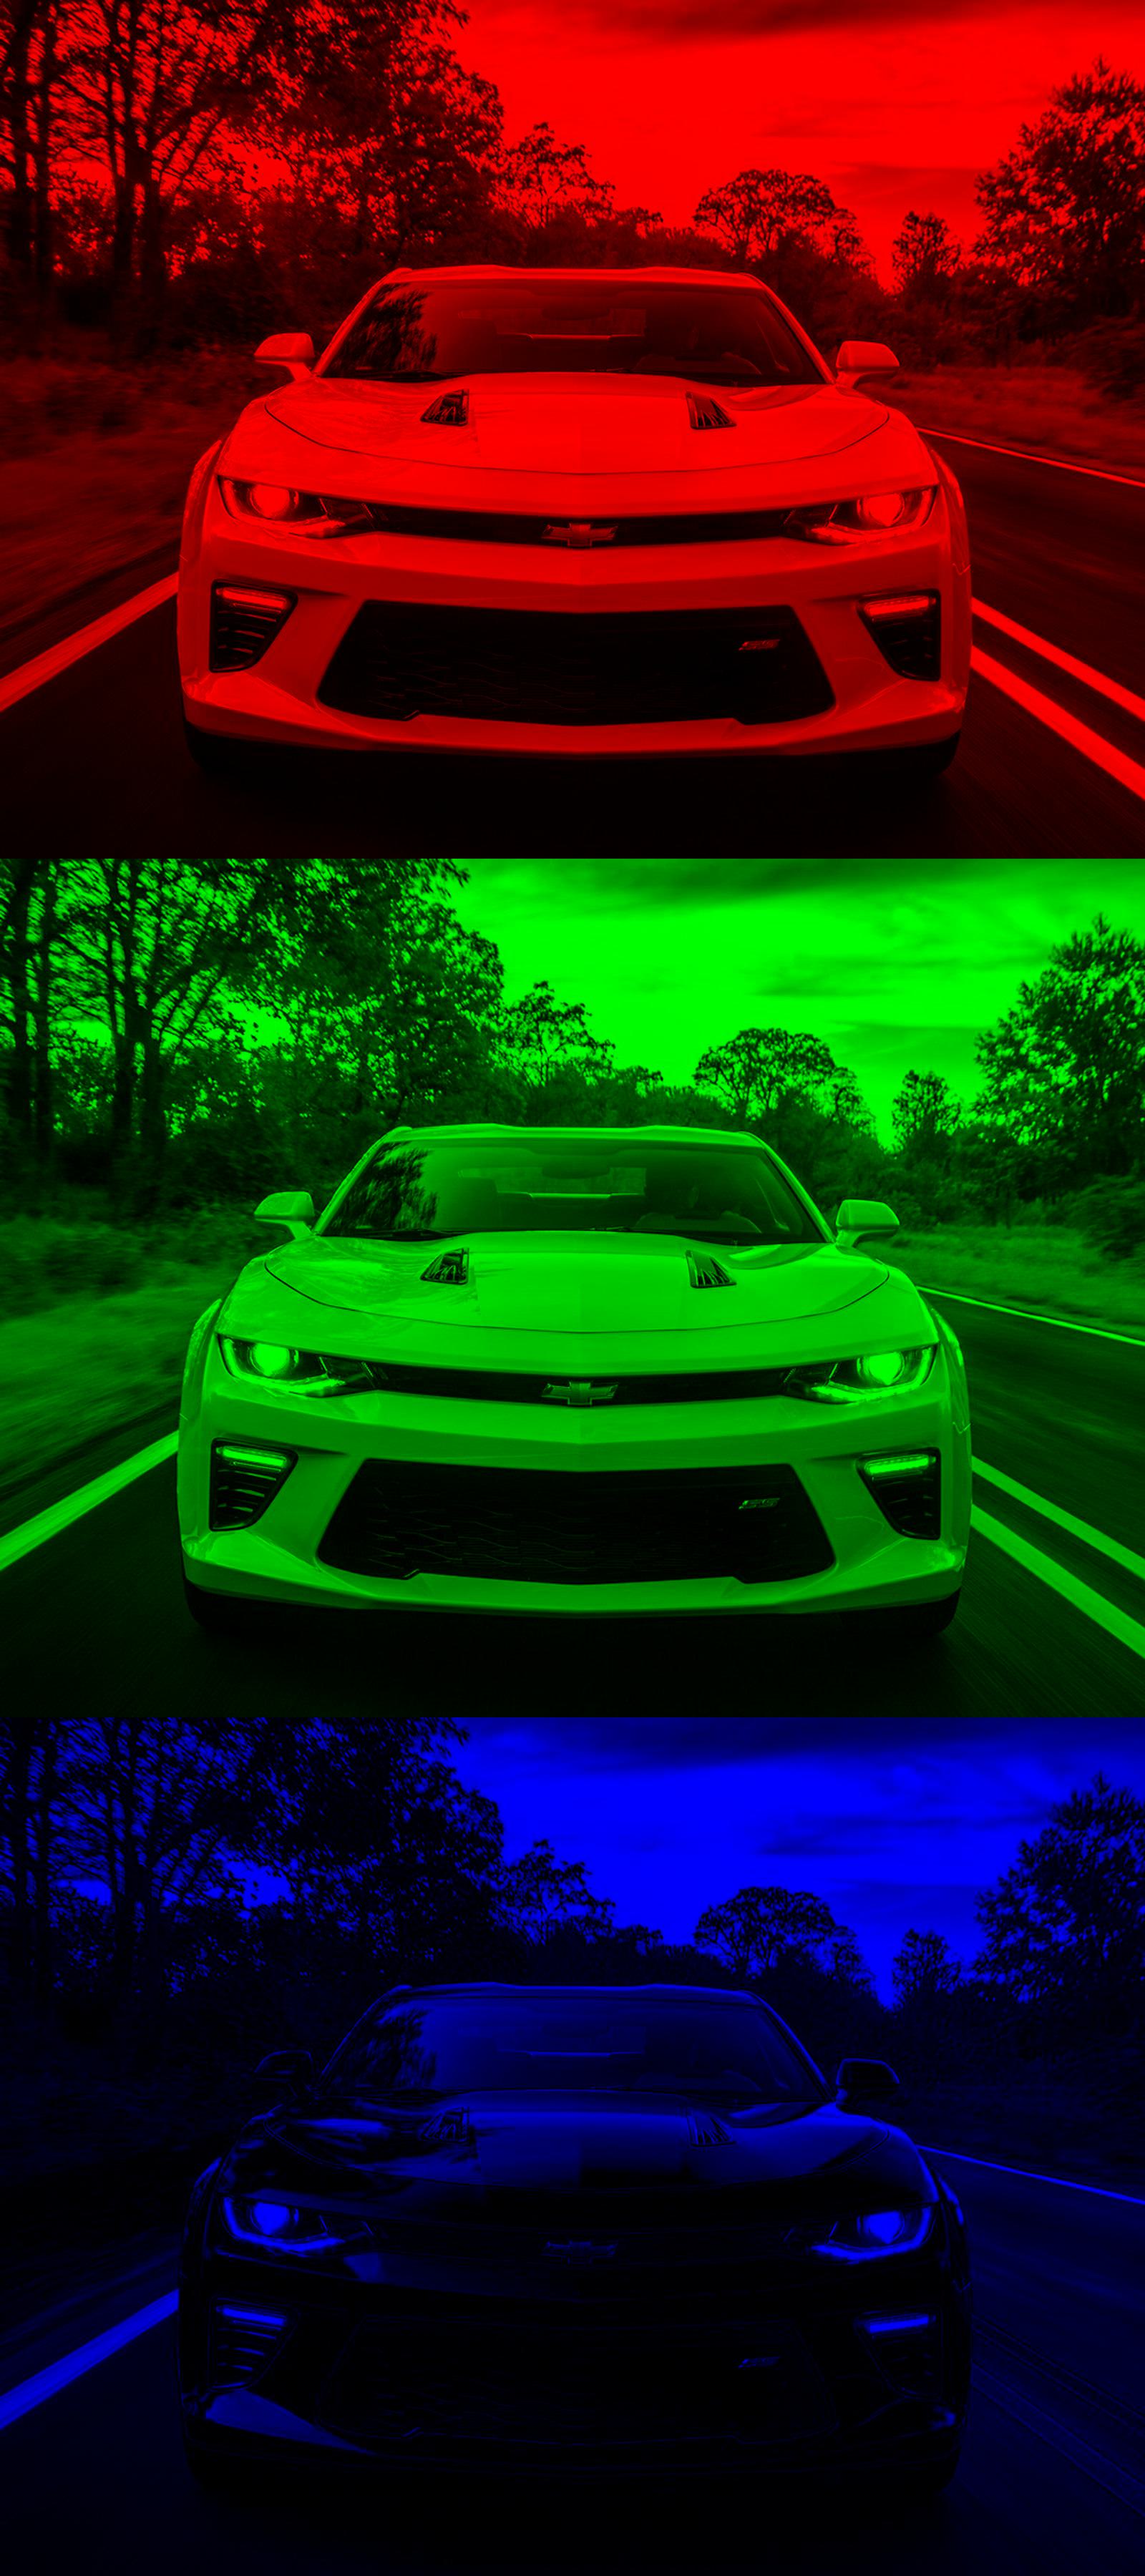
We can even use numpy to create new images with specefic color channels:
red = np.zeros(camaro.shape, dtype = "uint8") # create an array with the same shape as the image but filled with zeros
red[:,:,0] = camaro[:,:,0]                    # assgin the same color intensity values of the image for color index 0 which is red
plt.imshow(red)
plt.show()

green = np.zeros(camaro.shape, dtype = "uint8") # create an array with the same shape as the image but filled with zeros
green[:,:,1] = camaro[:,:,1]                    # assgin the same color intensity values of the image for color index 1 which is green
plt.imshow(green)
plt.show()


blue = np.zeros(camaro.shape, dtype = "uint8")  # create an array with the same shape as the image but filled with zeros
blue[:,:,2] = camaro[:,:,2]                     # assgin the same color intensity values of the image for color index 2 which is blue
plt.imshow(blue)
plt.show()
we can then stack the created images to create one image with three individual dimensions of color:
camaro_rainbow = np.vstack((red,green,blue))
plt.imshow(camaro_rainbow)
plt.show()

io.imsave("camaro_camaro_rainbow.jpg", camaro_rainbow)